While finishing my reading of Python for Data Analysis(2nd Edition), I came to some data analysis exercise on MovieLens movie review data. I followed along the author's examples in most cases, but tried to expand on some area as he suggested.
I thought everything would be smooth sailing considering I was "following along" the exercise, except I was using the 2nd Edition dated from 2017. I figure I might as well follow along and do a data analysis of the dataset, as well as some interesting issues I ran into.
Goal: practice data analysis with a movie review dataset from 2000 and learn from this experience.
First task is to download the data and review the readme file to understand the data structure and their relationship. 👍
Next step let's take a look of the data in notepad to compare it with README. Look simple enough with two columns (::) as separators. 👍
Let's import and review the data. Author used read_table function so I'll use the same code and let's see what happens...
Interesting. Why am I getting a warning and an error?
- Parsewarning - looks like we can add "engine='python" to eliminate the warning.
- Codec issue - something about the text encoding of movies.dat file not being UTF-8 standard. Googling around and I found at least couple of solutions:
- By using notepad, I can save-as the file into UTF-8 format.
- Use chardet, Python character encoding detector package and read in some part of the files to determine the encoding; then use the encoding method to read the file.
 |
| Dataset quick comparison of keys |
 |
| Combined dataset |
- There are more male ratings than female ratings.
- There are more ratings from age 25 years old group.
- "Comedy" genre movies are the most popular, with the most number of ratings (333,823 ratings).
- "Documentary" genre movies are the least popular, with the least number of ratings (5,705 ratings).
- There are many movies with only 1 rating. There are also many movies with more than 2,000 ratings. The mean (269) of the rating is greater than the median (123) of the rating, implying that there are many ratings on the higher end, skewing the mean to the right side of the median.
 |
| Top 10 rated movies M+F |
 |
| Top 10 male rated movies |
 |
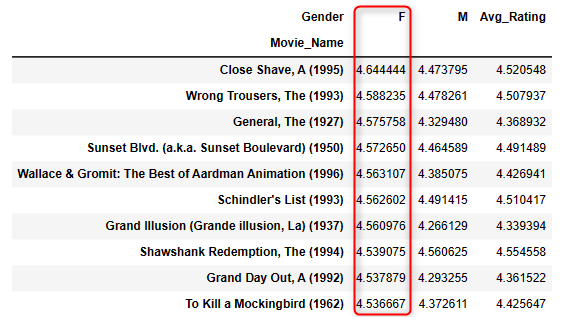
| Top 10 female rated movies |
On the genres, how many different genres are there? Looks like there are 18 individual genres.
 |
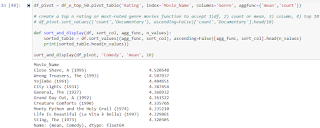
| Top 10 rated comedy movies |
 |
| Top 10 rated film-nor movies |
Conclusions:
- Keep the dataframe as simple as possible.
- There are different plotting capabilities within Python - calling plot function within dataframe seems to be more efficient than calling matplotlib. I ran into an issue when it took over 20 minutes to plot the histogram, to find out the issue is python trying to write out the individual x-axis tick on the chart where they over-wrote each other in the limited space.
- Need to review and practice more multi-index dataframe. Or maybe just simplify it - do I really need to use multi-index?
- Don't underestimate the complexity of the datasets even when it looks simple. This dataset took me two weeks to sort through some of the issues I ran into. The actual writeup time is much more than the time spent on analysis.
- Practice, practice, and more practice. 😞
Python jupyter notebook file: here
Citation:
The dataset is downloaded from https://grouplens.org/datasets/movielens/1m/. This is the old dataset from 2/2003.
Acknowledge use of the dataset:
F. Maxwell Harper and Joseph A. Konstan. 2015. The MovieLens Datasets: History and Context. ACM Transactions on Interactive Intelligent Systems (TiiS) 5, 4: 19:1–19:19. https://doi.org/10.1145/2827872
Example code from book author -
https://github.com/wesm/pydata-book/tree/2nd-edition


