Showing posts with label Python. Show all posts

Sunday, April 30, 2023

Movie Rating Data Review

While finishing my reading of Python for Data Analysis(2nd Edition), I came to some data analysis exercise on MovieLens movie review data.  I followed along the author's examples in most cases, but tried to expand on some area as he suggested.

I thought everything would be smooth sailing considering I was "following along" the exercise, except I was using the 2nd Edition dated from 2017.  I figure I might as well follow along and do a data analysis of the dataset, as well as some interesting issues I ran into.

Goal: practice data analysis with a movie review dataset from 2000 and learn from this experience.

First task is to download the data and review the readme file to understand the data structure and their relationship.  👍


Next step let's take a look of the data in notepad to compare it with README.  Look simple enough with two columns (::) as separators.  👍


Let's import and review the data.  Author used read_table function so I'll use the same code and let's see what happens...
  
Warning message


Error message

Interesting.  Why am I getting a warning and an error?
    - Parsewarning - looks like we can add "engine='python" to eliminate the warning.

    - Codec issue - something about the text encoding of movies.dat file not being UTF-8 standard.  Googling around and I found at least couple of solutions:

  1. By using notepad, I can save-as the file into UTF-8 format.
  2. Use chardet, Python character encoding detector package and read in some part of the files to determine the encoding; then use the encoding method to read the file.
After making the changes, the datesets are loaded successfully.  Let's review the data and see if there is anything we should be aware of.

Users dataset - there is no null values within the 6040 rows, and no duplicated UserID.  I'm not concerns with duplicates with other columns because they serve as grouping / categories.  There are more male users than female users, ~2.5 times more. 

Users dataset preview / examination

Movies dataset - Since there is only Movie_ID column that has numerical values, the describe() call does not reveal any useful information.  It looks like the movie release year is included in the Movie_Name column inside the parentheses.  The Genre column can have multiple genres separated by pipe (|) symbol.  There is no duplicate or null value in Movie_ID or Movie_Name field.

Movies dataset preview / examination

Ratings dataset - Looks like there is no null values among the data.  A check of the duplicates of UserID and Movie_ID shows that there is no duplicates.  The average rating is 3.58 but the median rating is 4.  This implies there is a long left tail - likely there are ratings of 1's pulling the average ratings down from the median.
Ratings dataset review


Rating distribution

Before doing any further analysis, it will be easier to combine the datasets together.  Between users and  ratings, they have a common column User_ID to merge on.  Between ratings and movies dataset, they have Movie_ID to get on.  We can merge the datasets together by using nesting two merge function - pd.merge(pd.merge(ratings, users), movies) because pandas can identify the common key to merge on.

 
Dataset quick comparison of keys

Combined dataset

A few observation from the data once they are combined -
  • There are more male ratings than female ratings.
Ratings count by gender
  • There are more ratings from age 25 years old group.
Ratings by age group
  • "Comedy" genre movies are the most popular, with the most number of ratings (333,823 ratings).
  • "Documentary" genre movies are the least popular, with the least number of ratings (5,705 ratings).
Ratings average and count by genre
  • There are many movies with only 1 rating.  There are also many movies with more than 2,000 ratings.  The mean (269) of the rating is greater than the median (123) of the rating, implying that there are many ratings on the higher end, skewing the mean to the right side of the median.
Rating count distribution plot

The author focuses on ratings between male and female users, and suggests readers to look into the movie genre.  Considering that there are many movies with a single rating, author filters the dataset with 250 ratings.  By looking at how many ratings each movie has, I'm using the median / 123 ratings instead of 250 ratings. 

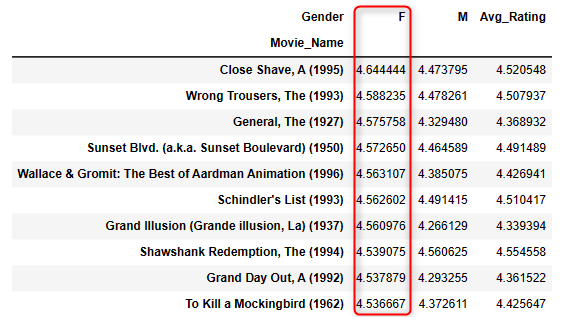
The top 10 rated movies (overall) and the top 10 male rated movies and top 10 female rated moves are all different!  Is that a surprise? 😵

Top 10 rated movies M+F

Top 10 male rated movies

Top 10 female rated movies

On the genres, how many different genres are there?  Looks like there are 18 individual genres.

Action, Animation, Comedy, Children's, Sci-Fi, Documentary, War, Film-Noir, Horror, Western, Fantasy, Mystery, Musical, Crime, Adventure, Thriller, Romance, Drama.


What can we do about the genres?  Personally I would like to see the top 10 rated movies in the certain genre.  We know that comedy has the most ratings, and film-noir has the highest average rating, so let's take a look to see the top 10 movies for those two genre.

Top 10 rated comedy movies

Top 10 rated film-nor movies

Conclusions:
There is a lot more that I can explore with the dataset.  For example, I can explore how ratings evolve over time, how genre preference evolve over time, group users into different categories for movie research, and use the data to train for movie recommender based on a user's rating of a few movies.  By using the newer dataset, you can also review the movie preference trends over time.  I can also use Excel or PowerBI to conduct data analysis to evaluate my own skills across different tools.  This dataset is full of information to practice data analysis skill.  

Lessons Learned:
  • Keep the dataframe as simple as possible.
  • There are different plotting capabilities within Python - calling plot function within dataframe seems to be more efficient than calling matplotlib.  I ran into an issue when it took over 20 minutes to plot the histogram, to find out the issue is python trying to write out the individual x-axis tick on the chart where they over-wrote each other in the limited space.
  • Need to review and practice more multi-index dataframe.  Or maybe just simplify it - do I really need to use multi-index?
  • Don't underestimate the complexity of the datasets even when it looks simple.  This dataset took me two weeks to sort through some of the issues I ran into.  The actual writeup time is much more than the time spent on analysis.
  • Practice, practice, and more practice.  😞

Python jupyter notebook file: here

Citation:

The dataset is downloaded from https://grouplens.org/datasets/movielens/1m/.  This is the old dataset from 2/2003.  

Acknowledge use of the dataset:

F. Maxwell Harper and Joseph A. Konstan. 2015. The MovieLens Datasets: History and Context. ACM Transactions on Interactive Intelligent Systems (TiiS) 5, 4: 19:1–19:19. https://doi.org/10.1145/2827872

Example code from book author -

https://github.com/wesm/pydata-book/tree/2nd-edition


Monday, February 27, 2023

Python Tensorflow Windows 10 setup

 A few years ago I tried learning Machine Learning / Deep Learning and setting up TensorFlow on my computer.  I was not versed of any of the Python setup requirement, not to mention the potential conflicts between all the packages (not that I'm any good now).  I even purchased a laptop with a separate GPU instead of Intel's built-in GPU, thinking that I would be able to accelerate the learning.  Needless to say, I'm not certain if it's money well-spent, but I've certainly pushed my laptop as much as I can over the years.

Fast forward to recently that I'm restarting my ML / DL learning journey and would like to set up my system correctly this time.  I reinstalled Python to get the latest version, as well as setting up a different environment under Anaconda.  To my surprise, TensorFlow-gpu package is no longer supported because it has been merged with TensorFlow package (link).  How hard can installation be, one would think, considering the popularity of TensorFlow in the Python ML / DL circle?

Let's just say the procedure on tensflow.org/install/pip didn't help.  For whatever reasons, I was not able to get TensorFlow to see the GPU on my laptop after numerous tries.  NVIDIA GeForce Experience software was also giving me a hard time installing the latest video card driver, not to mention NVIDIA's cuDNN toolkit installation instruction being a bit confusing.  After fumbling around installing / uninstalling a few times, I was able to find a YouTube video providing the much needed help to get through.  I'm attaching the link here for reference.

Copying from his YouTube page, I'm also adding some of my comments in blue because there's been changes since his video from '21.  (credit - Aladdin Persson)

Thursday, November 10, 2022

Combine data from multiple Excel files or multiple Excel sheets

From time to time we (or maybe just me 😕) end up compiling data / information on multiple Excel sheets or files with the same format.  For example - a sales person may use an Excel sheet to input orders for each store, then consolidate all the order sheets together to submit a master order.  In the past I would take the time to combine the sheets together in one file, then link them together and create a total sheet.  This way I would have individual data for record.  I thought it would be interesting create a case to combine multiple Excel sheets or files together and sum all the information.

There are two separate tasks for this project - 

1. load data from multiple sheets within the same Excel file, and combine the data together and summarize the result.


2. load data from multiple Excel files within the folder / file directory, and combine the data together and summarize the result. 

Lessons learned from doing this exercise -

  • Excel stores all numbers as floats internally.
  • When there is Null value (NaN) in the dataset, read_excel cannot convert the data type to integer while reading in the data.  Need to remove the Null values before converting the data type.
  • Sometimes there are easier ways to accomplish a task.  Apparently Microsoft Excel implemented this feature since Excel for Mac 2011, and available for Excel for Microsoft 365.
    • Microsoft's implementation isn't perfect because it doesn't include everything I want after combing the data, but it is much easier than writing Python codes after couple of trial & error.

Data files - 

  • Example files location: here.
  • To combine multiple sheets in an Excel file, use Multi_sheet.xlsx.
  • To combine multiple Excel files, create a folder and copy single-1.xlsx, single-2.xlsx, single-3.xlsx files into the folder.  Update the variable dirname to reflect the file directory in the Python code / Jupyter notebook.
Python Jupyter notebook file -
Possible future improvement -
  • Convert to Google Colab format for easy online usage.

Wednesday, September 21, 2022

Datacamp Case Study - Databel Churn investigation

While doing my Tableau lessons on Datacamp, one of the courses was a case study to analyze customer churn in Tableau (Case Study: Analyzing Customer Churn in Tableau).  To practice my Python skill, I decided to use the data set from the course and analyze it using Python and show my analysis here.

Databel is a fictitious cell phone company.  The company executes want to understand customer churn situation and recommendations to reduce churn.

Top findings -

  • Current churn rate is 26.86% with 6687 customers.
  • Top churn reasons from the provided dataset - 
    1. Competitor make better offer
    2. Competitor had better devices
    3. Attitude of support person
    4. Don't know
    5. Competitor offered more data
  • Majority of the customers do not belong in a group plan.  Customers without group contract have higher than average churn rate (32%).
  • Customers are price sensitive to the international plan charge and international call usage.  
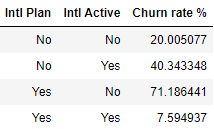
    • Churn rate is higher for customers making many international calls but not on the international calling plan, as well as customers on the international calling plan but not actively making international calls.
  • More than half of the customers are on month-to-month contract.  
    • Customers on Month-to-month contract type account for majority of the churn(87%).
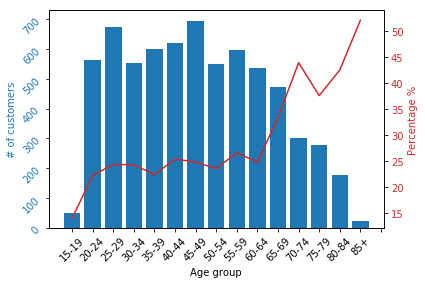
  • Customers age 65 and above have higher churn rate than other age group.  However, seniors account for less than 20% of the total customer base.  

  • Customers on unlimited data plan have higher churn rate than customers not on data plan.

Recommendation -

  • Review current customer base who's not part of a group or on a contract.  Develop marketing and sales promotion to encourage customers to join a group or contract.
  • Review current customer base who's on the international calling plan and their international call usage.  Develop new pricing plan to turn on / off international calling plan automatically based on monthly usage.
  • Review current customer relation management system to ensure automatic number identification system is implemented, and a call history tracking system is on place.  When a customer calls the support or customer service department, all the previous interaction with the customer is listed for easy access so customers do not need to call and repeat unsolved issues.
  • Conduct full review of customer support and customer service procedures for quality assurance.  Provide additional trainings as needed to ensure staffs are equipped with what they need to support customers.
  • Churn rate for customers on unlimited data plan is higher than customers who are not on the unlimited data plan.  The dataset does not include current device offering information, or peak data download speed.  This will required further research to ensure company offers the latest devices and comparable data download speed.

Assumption made based on the project document, background and provided data

  • The churn rate calculated is a yearly figure.

Lessons learned from doing this exercise -

  • Be mindful of the grouping details - if it's inclusive for the upper and lower limit when doing the calculation.  Test, verify and adjust the group title accordingly.
  • Data is not always complete.  Review the data before conducting any in-depth analysis.
  • Blogger is not a good site to post Jupyter notebook file.  The format of the file will take some time to fix.  I will have to look into posting my files on Github in the future.

Possible additional work in the future

  • Map churn rate by state and display on a map, similar to what can be done with Tableau.
  • Research further on cell phone industry churn rate and compare the statistics. 

Information about the data -

Databel meta data description - Databel metadata description from Datacamp

Databel data from Datacamp - Databel.csv data from Datacamp 

Tableau Public analysis based on Datacamp's course can be seen here - Databel Tableau Analysis

Jupyter notebook for the Python file and analysis - Databel Jupyter notebook

Tools I used -

Anaconda3 and Python 3.7


Google Data Analytics capstone project

Google Data Analytics capstone project

I decided to use blog as the venue to publish my Google Data Analytics learning because I wasn't sure how I can upload the findings, the...