Showing posts with label movie. Show all posts

Friday, June 30, 2023

Movie Data Analysis using Power BI

I wanted to compare Power BI and Python (and Tableau if I ever get to it) on the data analysis tasks so I figured it would be a good comparison using the movie data (see citation / acknowledgement of the dataset credit at the end) while the data is relatively fresh on my mind. 😅

I'm going through the data similar to what I did analyzing it with Python.  A summary of my findings first -

  • Power BI makes it easier to load / convert / review data.
  • Power BI is easier to create interactive graphical representation.
    • Be mindful the interactive nature of Power BI.  It can also lead to different interpretations based on what filters are set.
    • User can select the field and see the top rated movies or movies with most ratings.
Action Movie Rating Trend & Highest Rated Action Movies
    • There maybe interactive graphical representation Python packages that I'm not familiar with.
  • If you want to see the numerical representation of the 1Q, median, average, 3Q, you will need to create some measures using DAX, and drag in the necessary fields and select the appropriate calculation method.
  • You can only merge two tables / queries at a time.  To merge more than two tables / queries, we need to create a interim table / query then merge with the next table / query.  Although it is the same with Python merge function limit to with two tables, we can nest the merge together, creating a multiple table merge in Python.
  • Unfortunately, after loading in the DAT files and creating multiple tables, the Power Bi file is quite large as compared to Python Jupyter Notebook file (93 meg Power BI file versus 440 k Jupyter Notebook file).  For comparison purpose, the merged data file in CSV format is about 74 meg.
Detail findings - 
  • Data import is as easy as clicking a few buttons.  The encoding issue with Python, as well as separator between each data point, can be easily resolved by selecting from a drop-down menu!

  • Power BI has build-in tools to examine data quality and data distribution, making reviewing of individual columns easier.  However, you need to be mindful of the steps to ensure you review each and every columns, as well as combinations of columns if needed.

  • Note there are options under View - column quality / distribution / profile to show these details in Power Query Editor.  The information is usually based on the first 1,000 rows, so it is best to change the setting to profile the entire data set (see below left lower corner).  They do not provide table level summaries but they provide column level details.  This certainly makes the initial data review easier through graphical review, except you do not get the detail numerical value.


  • To verify if a combination of columns / fields have any duplicates, you can combine the columns together in Power Query Editor, and include a separator if the columns are numeric.  It is not as simple as a line of Python code, but it is easy enough to get done.  Review the column profile / distribution to verify any duplicates.  Side note - I noticed my Intel CPU usage went up while the column profiling was going through.  Is it possible that Power BI uses GPU for processing?  I will have to test it on my desktop computer with dedicated GPU to find out...  😁
Steps to Create a New Merge Column

Column Profiling
  • To split the genres into multiple rows, it is a click of a button within Query Editor using "Split Column" button and click the "By Delimiter," and selecting appropriate options (Advance option to split into rows instead of columns).


  • To see the statistical details of the Ratings table, I have to go through a few steps.
1. I need to create a table to group the Ratings by Movie_ID.
2. I need to create a few measures to calculate the different percentiles, IQR, upper and lower whiskers using DAX.
3. I need to create a table and drag in the appropriate measures and fields and use the appropriate calculation (min/max/standard deviation/etc).


4. Alternatively, you can search the Power BI add-in by clicking the 3 dots for more visuals and search for box plot and third party visual add-in.


5. I found a Box and Whisker by MAQ software to provide a good box plot visual with all the details.


  • Part of the initial EDA is to recognize that there are many high ratings (rated 5) movies with single user ratings.  On average a movie would have ~269 ratings with the median ~ 123 ratings.  On my Python analysis I went with the median instead of the average to filter out movies which do not have enough user ratings.  To do the same within Power BI, I add in a slider and use the Rating count within the Rating_group table.
    • Slider makes it easy to change the boundary in case the user prefer to use average instead of median, or if the user wants to see the unfiltered result.


With some drag and drop and copy and paste, it is easy to create a few interactive summaries - Top 10 movies by rating and count by gender, Top genres by rating and count by gender, and # of rating and average rating over time, all with a slider to control the minimum number of ratings to prevent low number of ratings skewing the results.

Top 10 Movies
Top Genres
Genre and Rating over Time

Issues:

Found an interesting issue that when I use Python to plot the box plot, the plot is different when I have one or two variables in the x-axis.  I'm not quite sure what the problem is, but it does not match my calculation (shown in red box below) or Python's estimate.  


File upload:

You can find my Power BI file here.

Citation:

The dataset is downloaded from https://grouplens.org/datasets/movielens/1m/.  This is the old dataset from 2/2003.  

Acknowledge use of the dataset:

F. Maxwell Harper and Joseph A. Konstan. 2015. The MovieLens Datasets: History and Context. ACM Transactions on Interactive Intelligent Systems (TiiS) 5, 4: 19:1–19:19. https://doi.org/10.1145/2827872

Tuesday, May 2, 2023

So I asked ChatGPT and Bard to analyze the data for me...

In case you've lived under a rock for the last 5+ months, you probably heard about OpenAI's chatGPT and Google's Bard Large Language Model (LLM) generative AI models.  ChatGPT's data is limited up to September of 2021, and as of this writing it is not connected to the Internet to pull information.  Google's Bard was recently (April 21, 2023) updated to have the ability to code (generation / debug / explanation) (article).

I played with chatGPT when my wife asked me about it when it first came out.  I have read about Natural Language Programming (NLP) a few years back but I haven't learned about the recent advancement.  I didn't think it would be that unique considering what I knew about NLP and our ability to google for an answer, and the limited data up to September of 2021.  The surprise came only after I used it for coding help - Excel, Python, PowerBI, etc.  It was able to code, or generate lines of code for specific request!  It saved me time from reading all the google search results / stack overfow codes to determine if a search result is the correct solution to my issue.  The key to get what you are looking for by return, you may need to provide certain structure, or information, or example, or prompt engineering, to get chatGPT to generate the intended reply.  

So, what is prompt to use?

please conduct a data analysis of the data from the attached link and provide a 4 paragraph summary - https://grouplens.org/datasets/movielens/1m/

From ChatGPT -

As an AI language model, I do not have access to the attached link. However, I can provide a general summary of the MovieLens 1M dataset provided by GroupLens and discuss potential insights that can be gained from conducting data analysis on the dataset.

The MovieLens 1M dataset contains movie ratings and demographic information for approximately 1 million users, along with information on 3,900 movies. The dataset includes information on user demographics such as age, gender, and occupation, as well as movie information such as genre, release year, and title. Ratings are provided on a scale of 1 to 5, with higher ratings indicating greater enjoyment of the movie.

By analyzing the MovieLens 1M dataset, one can gain valuable insights into user preferences for movies and identify trends and patterns in movie ratings. For example, one could examine the distribution of ratings across different genres of movies to identify which genres are more popular among users. Additionally, one could use clustering techniques to group users with similar tastes and identify common characteristics of those groups. These insights can be valuable for movie producers and distributors in understanding which types of movies are likely to be successful among different segments of the population.

Moreover, the MovieLens 1M dataset can be used to develop recommendation systems for movies. By analyzing the ratings of individual users and identifying similar users with similar ratings, one can develop personalized recommendations for users based on their individual tastes. This can improve the user experience on movie streaming platforms and increase engagement with the platform.

In conclusion, the MovieLens 1M dataset is a valuable resource for conducting data analysis on user preferences for movies. The dataset provides rich information on movie ratings and user demographics, and can be used to develop insights into user preferences, identify trends and patterns in movie ratings, and develop recommendation systems for movies. These insights can be valuable for movie producers and distributors in developing successful movies and improving the user experience on movie streaming platforms.

To say I'm disappointed is an understatement.  I guess ChatGPT still does not connect to the internet, and did not have history information from the internet of this old dataset.

Since Bard's recent update showed it is now capable of connecting to the internet, I figured why not give it a try as well.

Using the same prompt, this is from Bard -

Sure, I can do that. Here is a 4 paragraph summary of the data from the attached link:

The MovieLens 1M dataset is a collection of 1 million movie ratings from 6,000 users. The dataset includes information about the users, the movies, and the ratings. The users are identified by a unique ID number, and the movies are identified by a unique ID number and a title. The ratings are on a scale of 1 to 5 stars.

The data analysis of the MovieLens 1M dataset revealed some interesting insights about movie ratings. For example, the average rating for all movies in the dataset is 3.5 stars. The most popular movies in the dataset are those that have been rated highly by many users. These movies include The Shawshank Redemption, The Godfather, and The Dark Knight. The movies that are most highly rated in the dataset are those that have been rated highly by a small number of users. These movies include The Silence of the Lambs, Schindler's List, and Pulp Fiction.

The data analysis also revealed some trends in movie ratings over time. For example, the average rating for movies has increased over time. This is likely due to the fact that movies are becoming more and more popular. The popularity of different genres of movies has also changed over time. For example, comedies were more popular in the 1980s, while dramas were more popular in the 1990s.

The MovieLens 1M dataset is a valuable resource for anyone who wants to learn more about movie ratings. It is a large and diverse dataset that can be used to answer a wide variety of questions about movies.

Here are some additional insights that can be gained from the MovieLens 1M dataset:

The most popular movies are typically action, comedy, or drama films.

The most highly rated movies are typically drama films.

The average rating for movies has increased over time.

The popularity of different genres of movies has changed over time.

The most popular movies among men are typically action, comedy, or thriller films.

The most popular movies among women are typically drama, comedy, or romance films.

The most highly rated movies among men are typically drama films.

The most highly rated movies among women are typically drama films.

The MovieLens 1M dataset is a valuable resource for anyone who wants to learn more about movie ratings. It is a large and diverse dataset that can be used to answer a wide variety of questions about movies.

Wow.  That's good for basic data analysis.  I need to step up my game otherwise companies can use AI to conduct analysis with obvious feedback.  With prompt engineering, you can ask ChatGPT / Bard to provide explicit assumptions used, or include your specific assumptions in your prompt so AI takes that into account when preparing your specific answer.

I feel that Bard has a slight advantage over ChatGPT when you want to feed external data to AI to conduct the data analysis, assuming you are OK that OpenAI or Google get to review your data.  If you are not OK with someone else seeing your data - then you're stuck with using AI for coding support for the time being.  😓

You can sign up ChatGPT here, and Bard here.

Sunday, April 30, 2023

Movie Rating Data Review

While finishing my reading of Python for Data Analysis(2nd Edition), I came to some data analysis exercise on MovieLens movie review data.  I followed along the author's examples in most cases, but tried to expand on some area as he suggested.

I thought everything would be smooth sailing considering I was "following along" the exercise, except I was using the 2nd Edition dated from 2017.  I figure I might as well follow along and do a data analysis of the dataset, as well as some interesting issues I ran into.

Goal: practice data analysis with a movie review dataset from 2000 and learn from this experience.

First task is to download the data and review the readme file to understand the data structure and their relationship.  👍


Next step let's take a look of the data in notepad to compare it with README.  Look simple enough with two columns (::) as separators.  👍


Let's import and review the data.  Author used read_table function so I'll use the same code and let's see what happens...
  
Warning message


Error message

Interesting.  Why am I getting a warning and an error?
    - Parsewarning - looks like we can add "engine='python" to eliminate the warning.

    - Codec issue - something about the text encoding of movies.dat file not being UTF-8 standard.  Googling around and I found at least couple of solutions:

  1. By using notepad, I can save-as the file into UTF-8 format.
  2. Use chardet, Python character encoding detector package and read in some part of the files to determine the encoding; then use the encoding method to read the file.
After making the changes, the datesets are loaded successfully.  Let's review the data and see if there is anything we should be aware of.

Users dataset - there is no null values within the 6040 rows, and no duplicated UserID.  I'm not concerns with duplicates with other columns because they serve as grouping / categories.  There are more male users than female users, ~2.5 times more. 

Users dataset preview / examination

Movies dataset - Since there is only Movie_ID column that has numerical values, the describe() call does not reveal any useful information.  It looks like the movie release year is included in the Movie_Name column inside the parentheses.  The Genre column can have multiple genres separated by pipe (|) symbol.  There is no duplicate or null value in Movie_ID or Movie_Name field.

Movies dataset preview / examination

Ratings dataset - Looks like there is no null values among the data.  A check of the duplicates of UserID and Movie_ID shows that there is no duplicates.  The average rating is 3.58 but the median rating is 4.  This implies there is a long left tail - likely there are ratings of 1's pulling the average ratings down from the median.
Ratings dataset review


Rating distribution

Before doing any further analysis, it will be easier to combine the datasets together.  Between users and  ratings, they have a common column User_ID to merge on.  Between ratings and movies dataset, they have Movie_ID to get on.  We can merge the datasets together by using nesting two merge function - pd.merge(pd.merge(ratings, users), movies) because pandas can identify the common key to merge on.

 
Dataset quick comparison of keys

Combined dataset

A few observation from the data once they are combined -
  • There are more male ratings than female ratings.
Ratings count by gender
  • There are more ratings from age 25 years old group.
Ratings by age group
  • "Comedy" genre movies are the most popular, with the most number of ratings (333,823 ratings).
  • "Documentary" genre movies are the least popular, with the least number of ratings (5,705 ratings).
Ratings average and count by genre
  • There are many movies with only 1 rating.  There are also many movies with more than 2,000 ratings.  The mean (269) of the rating is greater than the median (123) of the rating, implying that there are many ratings on the higher end, skewing the mean to the right side of the median.
Rating count distribution plot

The author focuses on ratings between male and female users, and suggests readers to look into the movie genre.  Considering that there are many movies with a single rating, author filters the dataset with 250 ratings.  By looking at how many ratings each movie has, I'm using the median / 123 ratings instead of 250 ratings. 

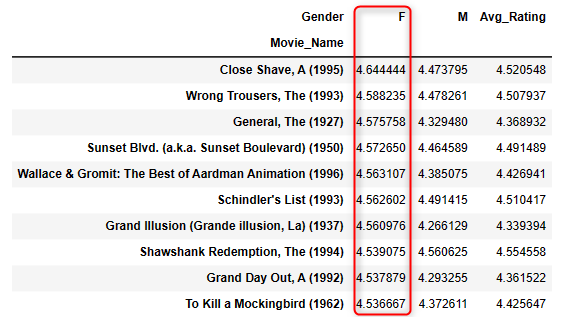
The top 10 rated movies (overall) and the top 10 male rated movies and top 10 female rated moves are all different!  Is that a surprise? 😵

Top 10 rated movies M+F

Top 10 male rated movies

Top 10 female rated movies

On the genres, how many different genres are there?  Looks like there are 18 individual genres.

Action, Animation, Comedy, Children's, Sci-Fi, Documentary, War, Film-Noir, Horror, Western, Fantasy, Mystery, Musical, Crime, Adventure, Thriller, Romance, Drama.


What can we do about the genres?  Personally I would like to see the top 10 rated movies in the certain genre.  We know that comedy has the most ratings, and film-noir has the highest average rating, so let's take a look to see the top 10 movies for those two genre.

Top 10 rated comedy movies

Top 10 rated film-nor movies

Conclusions:
There is a lot more that I can explore with the dataset.  For example, I can explore how ratings evolve over time, how genre preference evolve over time, group users into different categories for movie research, and use the data to train for movie recommender based on a user's rating of a few movies.  By using the newer dataset, you can also review the movie preference trends over time.  I can also use Excel or PowerBI to conduct data analysis to evaluate my own skills across different tools.  This dataset is full of information to practice data analysis skill.  

Lessons Learned:
  • Keep the dataframe as simple as possible.
  • There are different plotting capabilities within Python - calling plot function within dataframe seems to be more efficient than calling matplotlib.  I ran into an issue when it took over 20 minutes to plot the histogram, to find out the issue is python trying to write out the individual x-axis tick on the chart where they over-wrote each other in the limited space.
  • Need to review and practice more multi-index dataframe.  Or maybe just simplify it - do I really need to use multi-index?
  • Don't underestimate the complexity of the datasets even when it looks simple.  This dataset took me two weeks to sort through some of the issues I ran into.  The actual writeup time is much more than the time spent on analysis.
  • Practice, practice, and more practice.  😞

Python jupyter notebook file: here

Citation:

The dataset is downloaded from https://grouplens.org/datasets/movielens/1m/.  This is the old dataset from 2/2003.  

Acknowledge use of the dataset:

F. Maxwell Harper and Joseph A. Konstan. 2015. The MovieLens Datasets: History and Context. ACM Transactions on Interactive Intelligent Systems (TiiS) 5, 4: 19:1–19:19. https://doi.org/10.1145/2827872

Example code from book author -

https://github.com/wesm/pydata-book/tree/2nd-edition


Google Data Analytics capstone project

Google Data Analytics capstone project

I decided to use blog as the venue to publish my Google Data Analytics learning because I wasn't sure how I can upload the findings, the...